In today’s digital age, data is the lifeblood of modern enterprises. Each day users are creating an incredible amount of data. But amassing mountains data is not use unless enterprises can generate insights and business value of it. Different target audiences can utilize the organizational data like Power Users, Data scientists, and existing reports on workspace and apps. That’s where Business Intelligence tools help.
Microsoft’s Power BI enables you to easily connect to your data sources, visualize, and share that with anyone.
Microsoft Power Platform comprises four Microsoft products – Power BI, PowerApps, Power Automate, and Power Virtual Agents to analyze data, build solutions and automate the processes.
- Power BI – Microsoft launched Power BI in July 2015, and there onwards, Power BI is exponentially growing its user base. Over the last few years, Power BI has seen several advancements to help users generate insights into vast amounts of data.
- Power Apps – PowerApps helps customers create apps that can be embedded into Power BI, and customized process functions can be achieved.
- Power Automate – It brings workflow automation into your apps with no or low code approach. Power Automate is used to build workflows for the repetitive manual process run automatically.
- Power Virtual Agents – This helps customers create and manage chatbots without code or AI knowledge.
This blog will deep-dive on Power BI and see how organizations can unlock value from their hidden enterprise data.
Defining Power BI
Power BI is a collection of apps, tools, and connectors that work together to turn your unstructured data into interactive insights. No matter where your data resides – be in a Microsoft Excel workbook, cloud-based and on-premises hybrid data warehouses, Power BI connects to your data sources and generates actionable insights.
Power BI is robust and enterprise-grade, ready to create reports and not only for extensive modeling and real-time analytics but also for custom development and sharing with anyone or everyone.
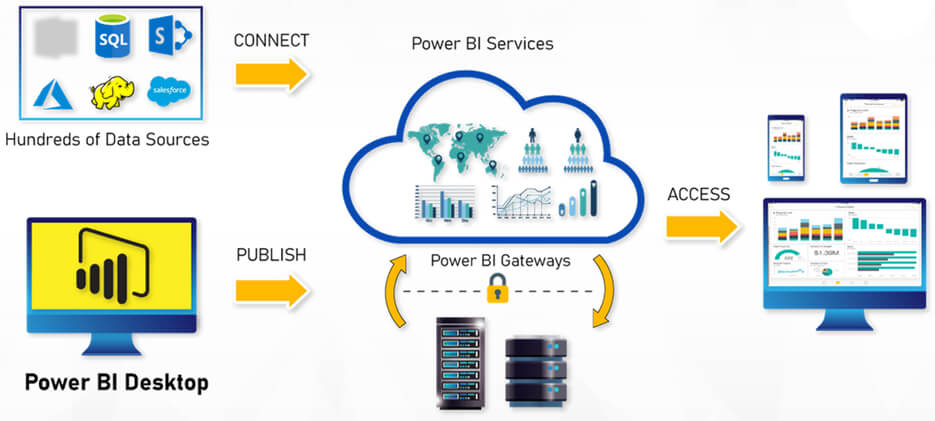
Power BI Architecture:

Power BI can be used as self-service analytics at an enterprise scale. Based on data volume, data processing, and visual sharing needs, users can opt for one of the below services:
Power BI Ecosystem
- Power BI Desktop:- Use the desktop-based tool to create Power BI reports (.pbix) with the version of Power BI Desktop optimized for the report server. Publish and view them in the web portal in your environment.
- Power BI Service:- The entry point for Power BI is a secure web portal, which you can access from any modern browser. Here, you can access all your reports and KPIs.
- Paginated reports:- Paginated reports (.rdl) are document-style reports with visualizations, in which tables expand horizontally and vertically to display all their data, continuing from page to page as needed. They’re great for generating fixed-layout, pixel-perfect documents optimized for printing, such as PDF and Word files. You can create paginated reports using Report Builder or Report Designer in SQL Server Data Tools (SSDT).
- Mobile Layout:- Power BI Reports are optimized for mobile devices. Users can use native mobile apps to connect to the Power BI service and consume reports on the go.
- Report Server:- Power BI Report Server allows organizations to deploy reporting solutions on-premise and move to Power BI Premium workspace later with no change to reports.
Power BI Licenses
There are three types of Power BI licenses. You can choose the relevant license type based on where the data is stored, and it will interact with the content.
- Power BI-Pro: License individual users with modern, self-service analytics to visualize data with live dashboards and reports and share insights across your organization.
- Power BI-Premium: Per User:- License individual users to accelerate access to insights with advanced AI, unlock self-service prep for big data, and simplify data management and access at enterprise scale.
- Power BI-Premium: Per capacity:- License your organization with the capacity to accelerate access to insights with advanced AI, unlock self-service prep for big data, and simplify data management and access at enterprise scale—without per-user licenses for content consumers.
Note:- For the latest update and Licences cost please visit the Microsoft site
Power BI – Features
-
- Data Management: Power BI helps in data governance, making organizational data accessible, usable, and protected. Effective data governance further enables proper assessment of possible gaps in processes, identifying areas where the organization needs to impose strict controls and where it needs to relax the rules. Governance leads to better data analytics, which empowers teams to make better decisions and improves operations support.
Strong Data Management can be implemented using the App, Workspace, and Report level access management feature.
- Data Management: Power BI helps in data governance, making organizational data accessible, usable, and protected. Effective data governance further enables proper assessment of possible gaps in processes, identifying areas where the organization needs to impose strict controls and where it needs to relax the rules. Governance leads to better data analytics, which empowers teams to make better decisions and improves operations support.
-
- Data Analytics:- Power BI’s advanced analytics features allow business users to analyze data and share insights. Power BI gives an end-to-end view of critical metrics and KPIs through intuitive and interactive dashboards. With Power BI tools, users can answer all their queries and address all the challenges by analyzing deep into the business data while being constructive and creative. Power BI’s advanced features include Quick Insights, Ask a Question, Integration with R, Segmentation & Cohort analysis, and Azure Machine Learning.
-
- Reporting
- Descriptive- Visualizations or reporting help to answer questions about what has happened based on historical data.
- Diagnostic- Visualizations or reporting help to answer questions about why events happened
- Predictive- Visualizations or reporting help to answer questions about what will happen in the future
- Prescriptive- Visualizations or reporting help answer questions about which actions should be taken to achieve a goal or target.
- Cognitive- Visualizations or reporting help answer questions about Sentiment Analysis, Key Phrase Extraction, Language Detection, and Image Tagging.
- Reporting
-
- Security: Power BI is built on Azure and is based on the following two clusters – Web Front End (WFE) and the Back-End cluster to manage authentification. Power BI leverages Azure Active Directory (AAD) to store and manage user identities to protect them from unauthorized access.
- Encryption – Microsoft uses encryption technology to protect data while at rest and when it travels between user devices and our Azure datacenters.
- Data Security – Row-level security (RLS) within Power BI is used to restrict data access for given users. Filters restrict data access at the row level, and you can define filters within roles. In the Power BI service, members of a workspace have access to datasets in the workspace. RLS doesn’t restrict this data access. In such a scenario, we use RLS at the semantic layer (Azure Analysis Services).
- Compliance – Power BI handles compliance required by leading data protection and privacy laws applicable to cloud services.
- Sensitivity Labels – Microsoft Information Protection sensitivity labels help users classify critical content in Power BI without compromising productivity or the ability to collaborate. Sensitivity labels can be applied to datasets, dataflows, reports, and dashboards.
- Security: Power BI is built on Azure and is based on the following two clusters – Web Front End (WFE) and the Back-End cluster to manage authentification. Power BI leverages Azure Active Directory (AAD) to store and manage user identities to protect them from unauthorized access.
- Integrations:- One of the important strengths of Power BI is the ability to integrate data from multiple sources. Power BI enables users to create a common data model and aggregate data from different sources – online services, on-prem data, databases, and files. Power BI connects to multiple data sources simultaneously and helps design data models for analysis. You can also use Power Query editor, built into Power BI, to add new sources.
Power BI – What it can do for you
- Connect to a variety of data sources with over 100+ built-in connectors
- Import and Prepare Data, Model, Visualize and Collaborate
- Use a variety of native Power BI visuals and the option to import custom visuals
- View and interact with shared reports & dashboards in Power BI Mobile apps or via a Web browser.
- Get notifications about alerts in the notification center
- Reduce the added cost, complexity, and security risks of multiple solutions
Power BI – Advantages and how it fairs with other BI tools
- Active Microsoft Forums, Community blogs where your query can be resolved quickly
- Provide monthly updates and fixes to the product
- Growing types of source connection across different product and environment
- Large options of using customized visuals present in the marketplace as desired for respective data
- Free training and guided materials available for new users on the website
- Microsoft provides cross-training learning material for other reporting skills persons
How Cambay Consulting can help you on your Digital modernization path?
Cambay, a Microsoft Managed Partner, is helping customers leverage the potential of Power BI to uncover business value and insights from their data.
-
- BI Strategic Lens – BI Assessment and Roadmap
Cambay will work with your organization to do a deep dive analysis into the best ways to maximize your BI investment. We help to get actionable intelligence at the right time to the right people
Learn more here on BI Strategy
- BI Strategic Lens – BI Assessment and Roadmap
- Power BI – Dashboard In a Day
Recently, Cambay’s hosted an interactive, hands-on workshop on Power BI. The workshop is designed to help business analysts to learn how to build reports and dashboards through a series of 5 labs. We cover end-to-end scenarios for building a Power BI Solution with all essential building blocks in Power BI.
View recording of the Power BI – Dashboard In-a-Day
Conclusion:
Cambay team will help you identify the Power BI potential by translating your sample data into insights with interactive reports and dashboards. Please write to us at sales@cambaysolutions.com to learn more.

Raghava Vedangi
Vice President - Azure Analytics


