
Cambay’s Power BI QuickStart is an ideal solution for organizations looking to explore the power of data visualization and business intelligence with minimal time investment. In just 2 to 3 weeks, our team works closely with you to understand your specific needs, gather relevant data, and deliver a tailored Power BI report—typically spanning 2 to 3 insightful pages. We go beyond just building reports, we design a custom Power BI template that reflects your organization’s branding, incorporating your logo and color palette to ensure consistency and professionalism.
This QuickStart program is perfect for organizations that are curious about the capabilities of Power BI but haven't yet taken the leap. Within a short span, you’ll have access to a live, interactive report that empowers your team to visualize data in meaningful ways, uncover insights, and make informed decisions. It's a hands-on introduction that shows exactly why Power BI is a game-changer for modern data analytics.
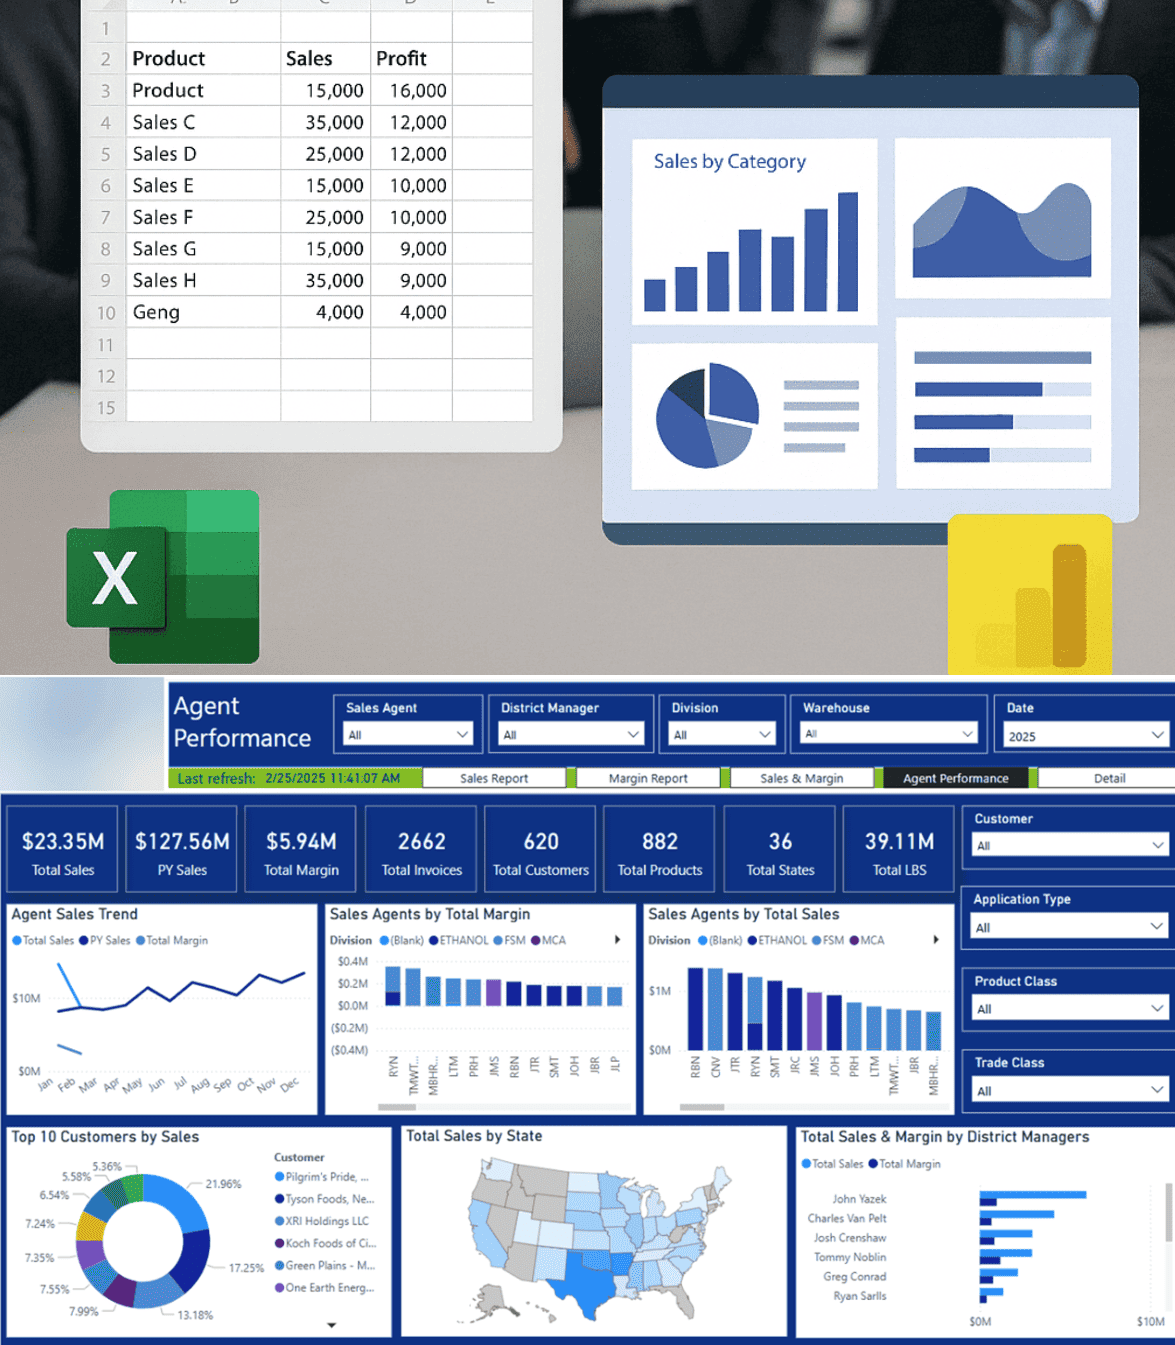
We start with an Excel spreadsheet of your choosing. Don’t worry—we’ll provide a simple template to help organize it effectively.
Working with your spreadsheet, we create a sleek Power BI report—complete with 3–4 analysis tabs showing real analytics power.
No need for enterprise-scale complexity. We focus on quick wins and instant insights without heavy data modeling.
We publish your report to Power BI and give you full access so you can explore, interact, and realize its value instantly.

One (1) Excel Spreadsheet Tab

Power BI Desktop
Where data meets insight
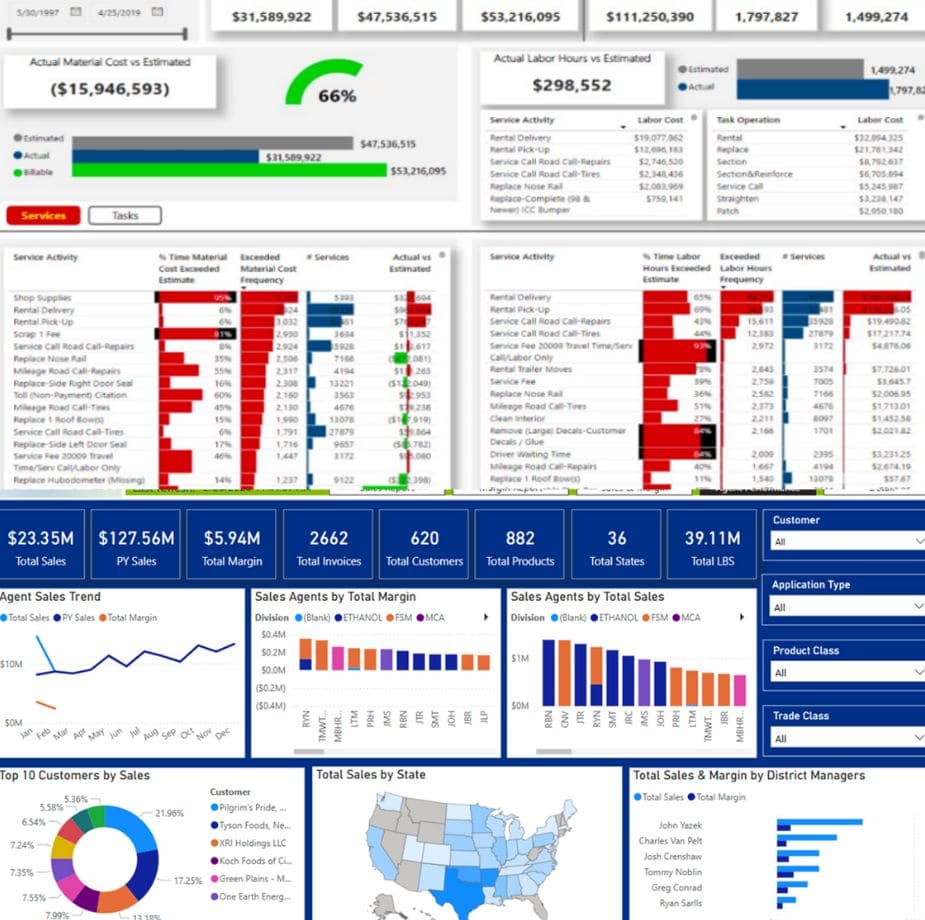
Up to 3–4 tabs in a single Power BI Report

Current: Disconnected systems (POS, online, CRM) slow insights.
Pain: No unified customer view.
QuickStart: Use 1 spreadsheet to reveal insights in a unified dashboard.
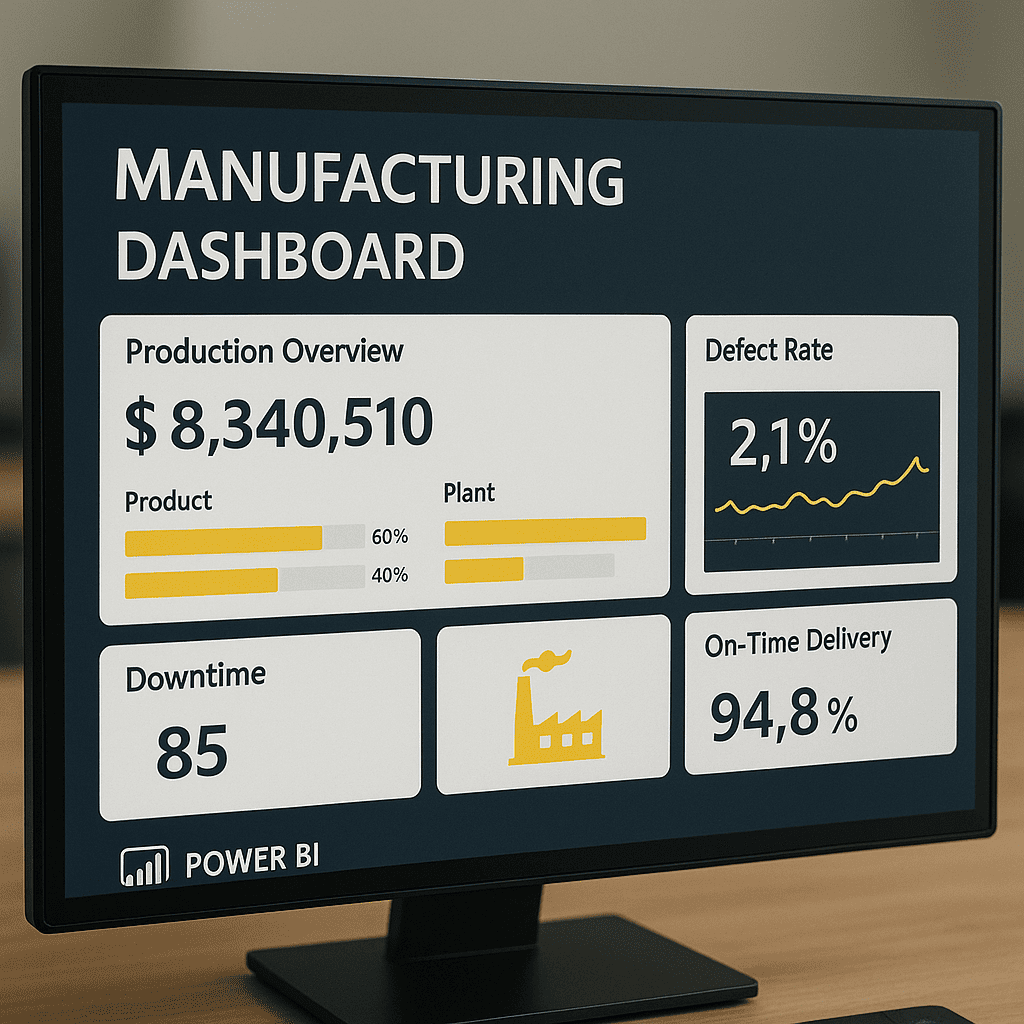
Current: Manual consolidation of production metrics.
Pain: Errors, delays, and poor forecasts.
QuickStart: Automate insights from factory spreadsheet data.
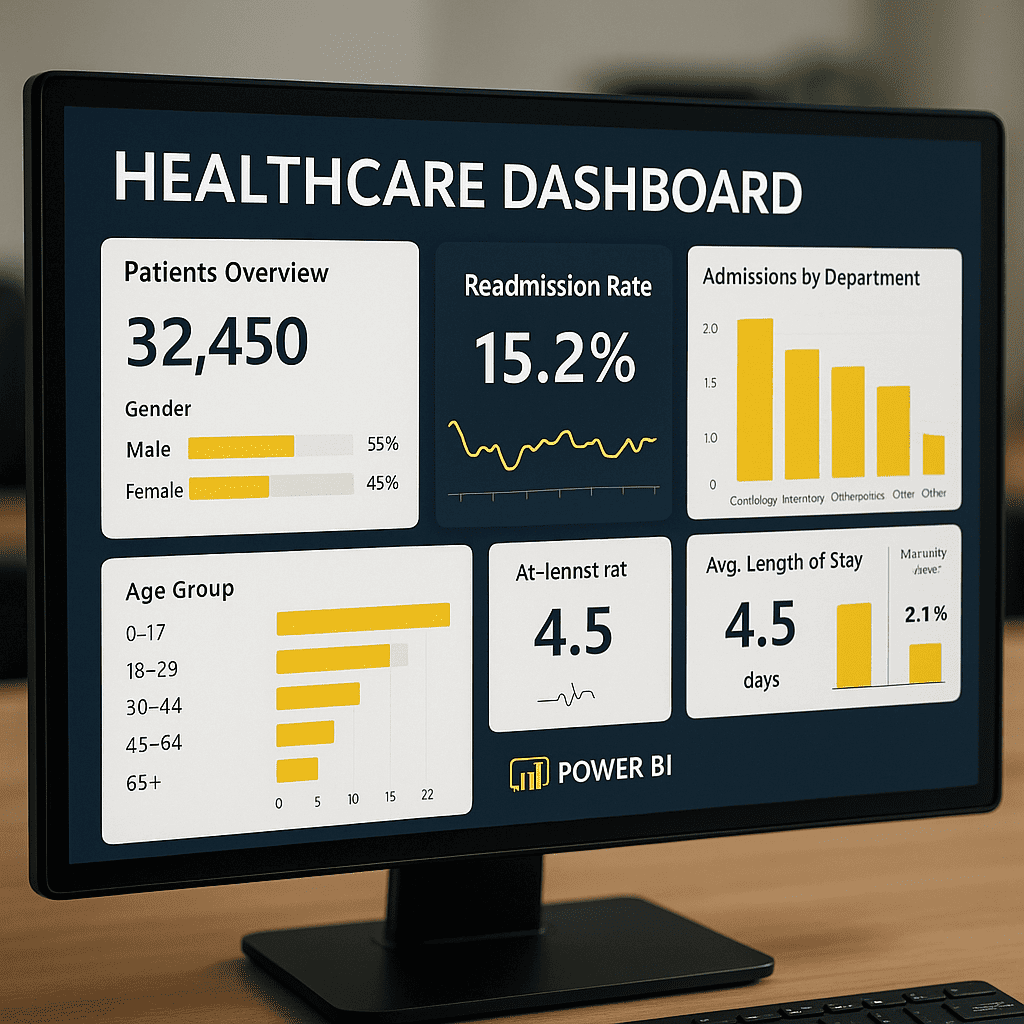
Current: Disparate EMRs complicate reporting.
Pain: Difficult compliance & KPI tracking.
QuickStart: Use a secure spreadsheet for HIPAA-compliant insights.
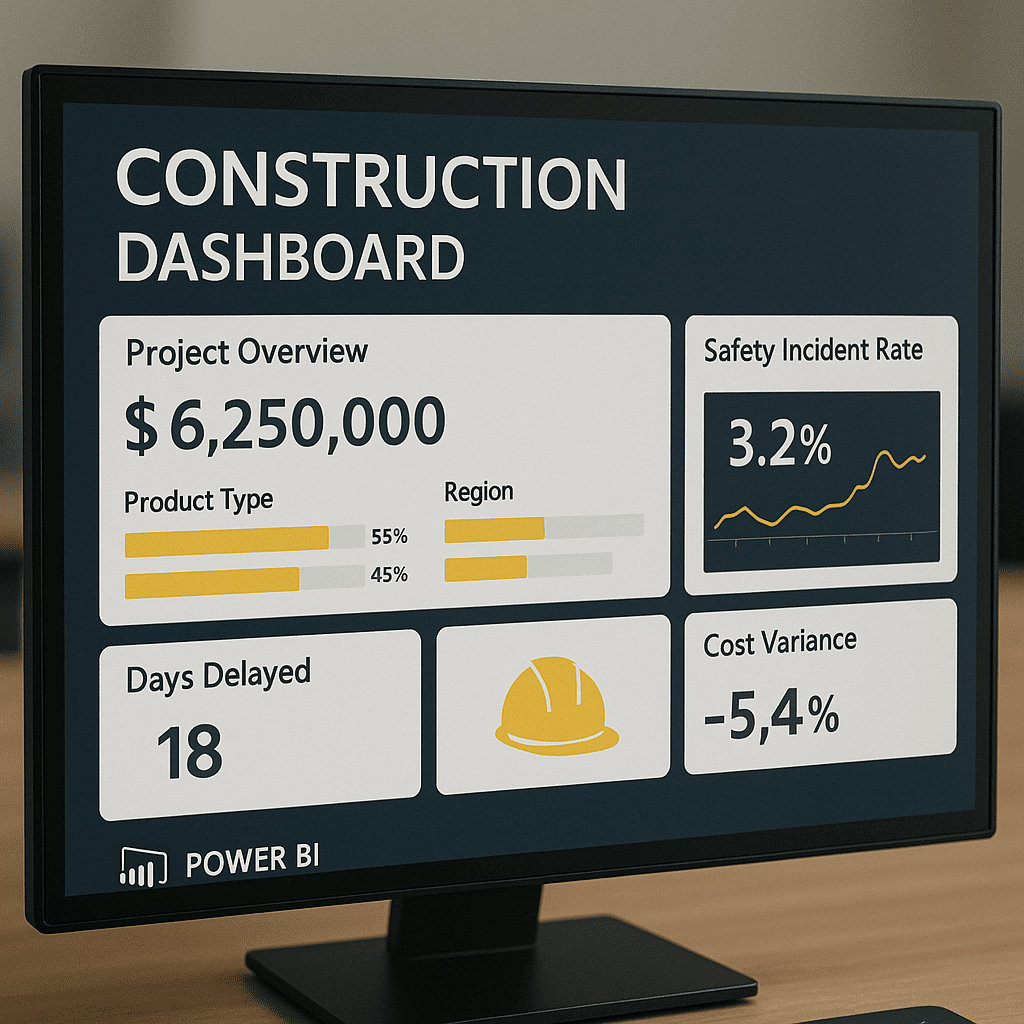
Current: Cost data scattered in PDFs/spreadsheets.
Pain: Late visibility into margin erosion.
QuickStart: Dashboard from one cost spreadsheet reveals P&L in real time.
4-week quick start Power BI experience
We Connect
Your Data
We Design
Your Data
We Build Your Report
2–3 Tabs, 1–2 Custom Calculations
We Deploy
Your Report!
Your data has a voice—Power BI lets it speak.
We use cookies to improve your browsing experience, analyze site traffic, and personalize content. By clicking "Accept", you agree to our use of cookies.